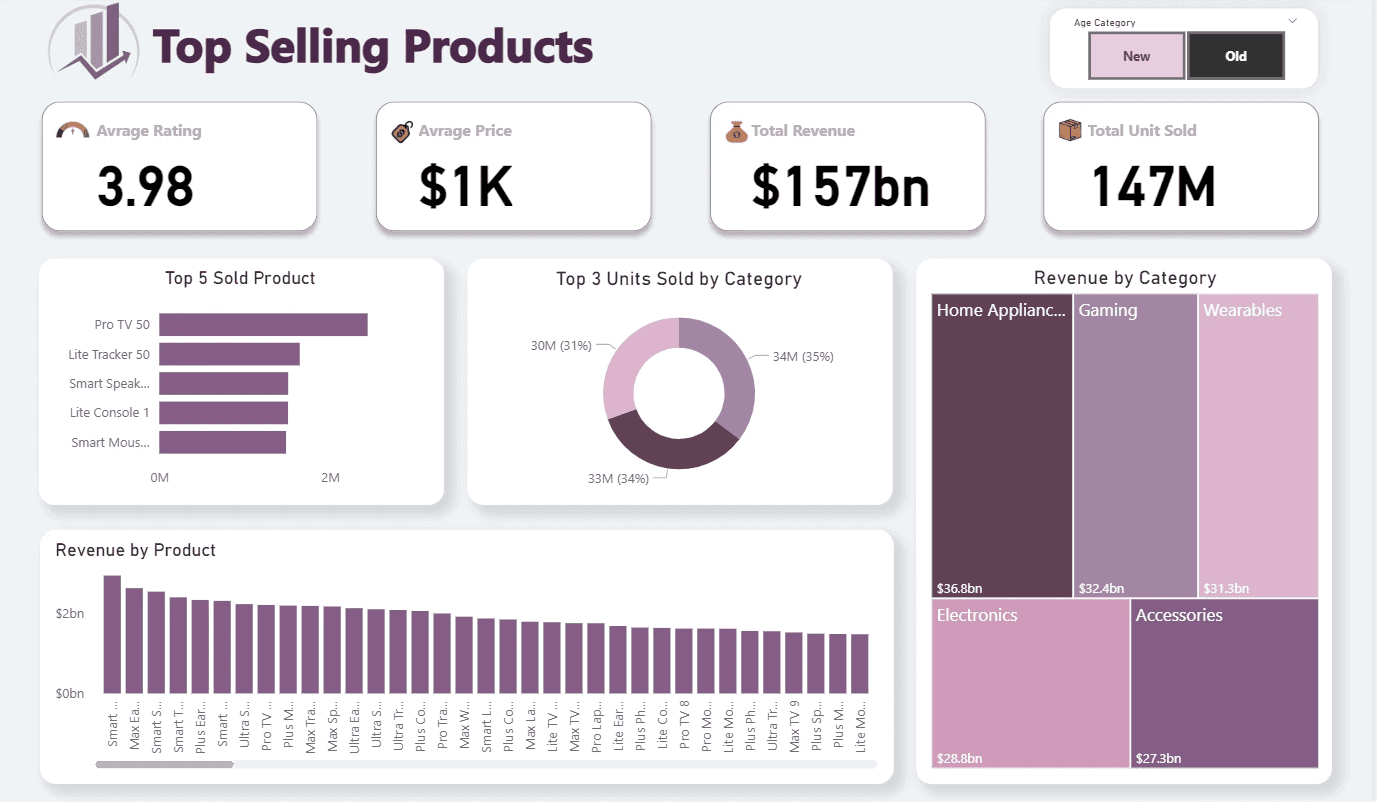
Top Products Dashboard

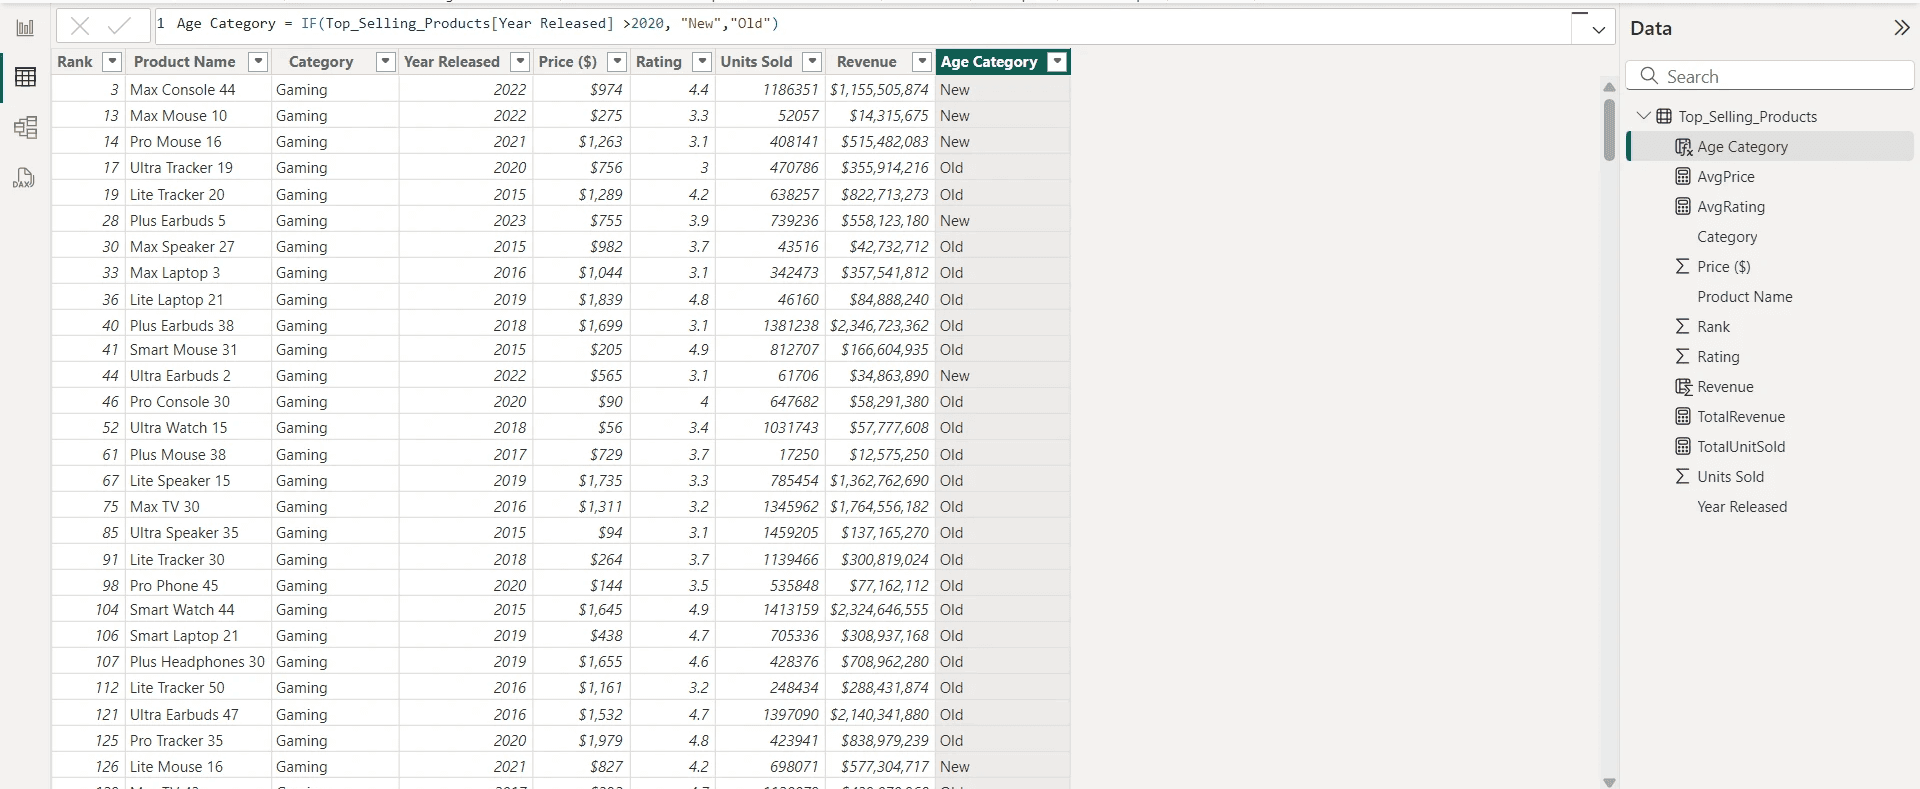
This interactive dashboard provides a comprehensive overview of product sales performance across categories. It enables stakeholders to quickly identify top-performing products, revenue leaders, and category-level trends. A custom calculated column was used to classify products as 'New' or 'Old', allowing dynamic filtering through a slicer to compare performance across product lifecycles.

Build in

Power BI

Date

2025
Pivot tables
Dashboard

Ready to uncover the insights behind your numbers?

Let’s make something incredible together! Reach out to discuss your project, and let’s create designs that resonate and inspire.

Ready to uncover the insights behind your numbers?

Let’s make something incredible together! Reach out to discuss your project, and let’s create designs that resonate and inspire.

Create a free website with Framer, the website builder loved by startups, designers and agencies.